
BQuant [5] - Profiling Memory and Performance
Profiling
We run into a lot of cases where we need to optimize some code: it’s slow or consuming excessive memory.
Profiling tools help with this. In this post, we’ll show two tools:
- cProfile: using %%prun cell magic in Jupyter notebooks.
- memray: For memory usage
- line_profiler: Another method to show line-by-line runtime
- memory_profiler: A simple method to show total memory used by a function
* I would also like to show pystack, but it doesn’t currently work in BQuant. But it’s a great toolkit.
What’s cprofile?
cProfile is a performance profiler for Python. Use it to understand which calls are taking the most time or are being called most often. Using cProfile is straightforward, with the %%prun cell magic in Jupyter notebooks enabling inline profiling reports. This tool is built into Python, making it widely accessible without the need for additional installations.
What’s Memray?
Memray is a great tool for visualizing memory usage of Python processes. Memray only runs on Linux, or certain versions of OSX, but not on Windows.
It happens to also be published by Bloomberg, but it’s independent from BQuant nothing to do with BQuant.
Memray and BQuant
In BQuant, it’s possible to run into problems with very large models and memory consumption. Memray is a handy tool for quickly visualizing where the memory is going.
It’s a very useful tool for understanding and analyzing the memory consumption of large models in BQuant.
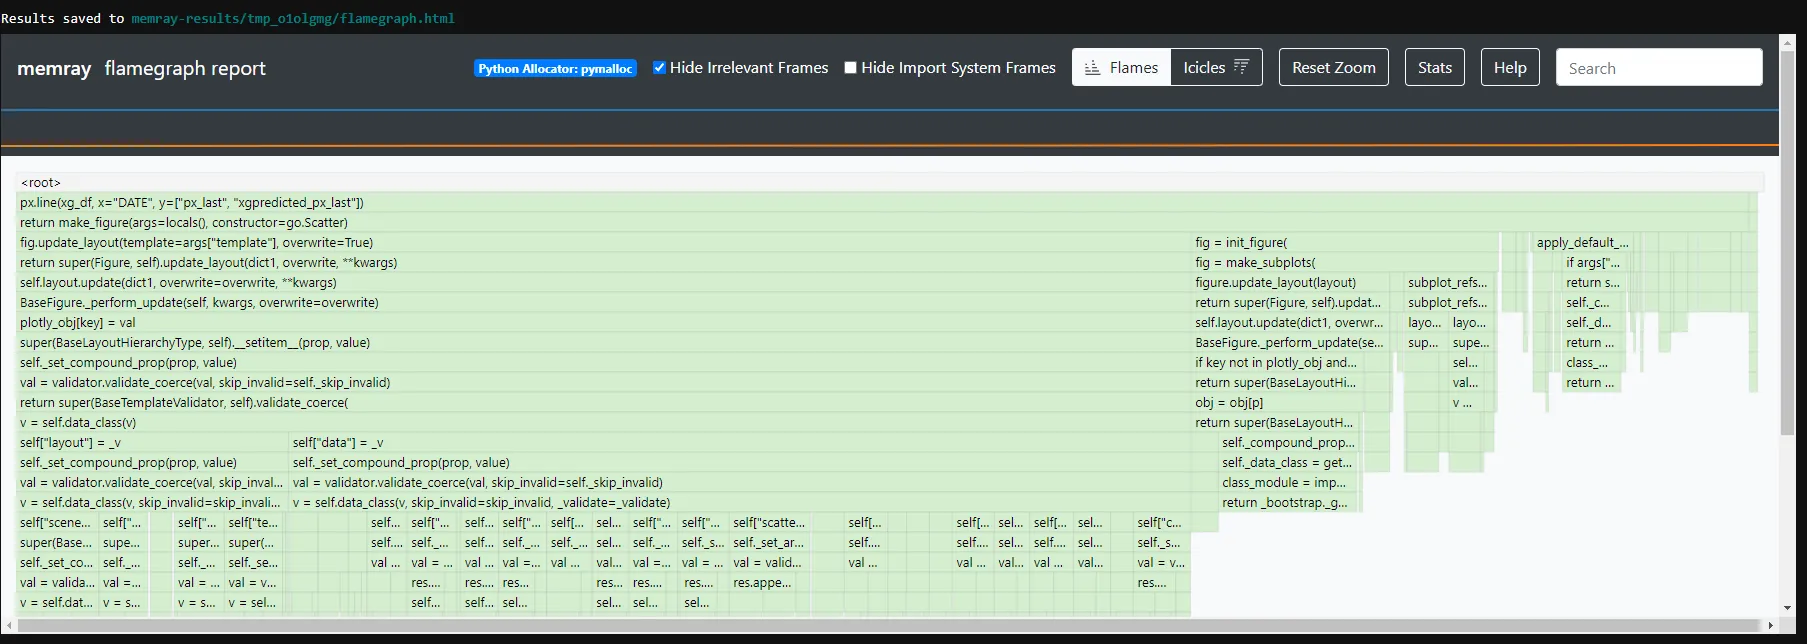 Fig 1: Example of a FlameGraph
bqnt_profiling.ipynb
Install memray
You can use %package or %pip.
This only needs to be run once per session, and only if memray is not in your Custom Environment.
NOTE: This only works on Linux or Mac. Will not install on Windows
# %pip install memray xgboost plotly
import os

if "BQUANT_USERNAME" not in os.environ:
    print("The remaining cells must be run in Bquant")
    assert False
The remaining cells must be run in Bquant
---------------------------------------------------------------------------
AssertionError                            Traceback (most recent call last)
Cell In[2], line 4
      2 if "BQUANT_USERNAME" not in os.environ:
      3     print("The remaining cells must be run in Bquant")
----> 4     assert False

AssertionError:
Load
Loading the extension makes the memray "magics" available in Jupyter
%load_ext memray
Generate Data
import bql
import xgboost as xgb
import plotly.express as px
daterange = 29  # days
security = "IBM US Equity"

basics_query = f"""get(
      px_last
    ) for(
      ['{security}']
    ) with(
      dates=range(-{daterange}d, 0d),
      fill=prev,
      currency=USD
    )"""

bql_svc = bql.Service()

response = bql_svc.execute(basics_query)
base_df = bql.combined_df(response)

# Reset the index: bql's combined_df returns ID as a sole index.
base_df = base_df.reset_index()

base_df["date_ordinal"] = base_df["DATE"].apply(lambda x: x.toordinal())
memray_flamegraph
%%memray_flamegraph

xg_df = base_df.copy()

xg_df['month'] = xg_df['DATE'].dt.month
xg_df['day_of_week'] = xg_df['DATE'].dt.dayofweek

train_df = xg_df.iloc[:-21]
test_df = xg_df.iloc[-21:]

X_train = train_df[['month', 'day_of_week']]
y_train = train_df["px_last"]

xmodel = xgb.XGBRegressor(n_estimators=100, learning_rate=0.1, objective='reg:squarederror')
xmodel.fit(X_train, y_train)

xg_df.loc[test_df.index, 'xgpredicted_px_last'] = xmodel.predict(test_df[['month', 'day_of_week']])

px.line(xg_df, x="DATE", y=["px_last", "xgpredicted_px_last"])
cprofile Profile
%%prun

xg_df = base_df.copy()

xg_df["month"] = xg_df["DATE"].dt.month
xg_df["day_of_week"] = xg_df["DATE"].dt.dayofweek

train_df = xg_df.iloc[:-21]
test_df = xg_df.iloc[-21:]

X_train = train_df[["month", "day_of_week"]]
y_train = train_df["px_last"]

xmodel = xgb.XGBRegressor(
    n_estimators=100, learning_rate=0.1, objective="reg:squarederror"
)
xmodel.fit(X_train, y_train)

xg_df.loc[test_df.index, "xgpredicted_px_last"] = xmodel.predict(
    test_df[["month", "day_of_week"]]
)

px.line(xg_df, x="DATE", y=["px_last", "xgpredicted_px_last"])
%pip install line_profiler
%load_ext line_profiler


def my_entrypoint():
    xg_df = base_df.copy()

    xg_df["month"] = xg_df["DATE"].dt.month
    xg_df["day_of_week"] = xg_df["DATE"].dt.dayofweek

    train_df = xg_df.iloc[:-21]
    test_df = xg_df.iloc[-21:]

    X_train = train_df[["month", "day_of_week"]]
    y_train = train_df["px_last"]

    xmodel = xgb.XGBRegressor(
        n_estimators=100, learning_rate=0.1, objective="reg:squarederror"
    )
    xmodel.fit(X_train, y_train)

    xg_df.loc[test_df.index, "xgpredicted_px_last"] = xmodel.predict(
        test_df[["month", "day_of_week"]]
    )

    px.line(xg_df, x="DATE", y=["px_last", "xgpredicted_px_last"])
Use Line_Profiler %lprun
%lprun -f my_entrypoint my_entrypoint()
Use timeit for Runtime
%timeit my_entrypoint
Memory_profiler
%pip install memory_profiler
%load_ext memory_profiler
%memit my_entrypoint